

In the 1950s, St Lucian economist Sir William Arthur Lewis theorised the ‘Dual Sector Model’ or the ‘Lewis Model’. The model examines structural change within developing economies which results in rapid periods of economic growth.
The Lewis model centres upon a dualistic economy, which is split into the agricultural “subsistence” sector and the industrial “modern” sector. This divide can be simplified to those working in rural labour and those working under urban conditions. Lewis posits that for the developmental process to occur in overpopulated developing countries, workers in the agricultural sector must internally migrate to urban areas and begin work in the industrial sector.
The model requires three assumptions. First, there is a surplus of labour in the agricultural sector. There are more people offering their service than the amount of labour that is required. There are two effects of this labour surplus. Firstly, underemployment occurs as individuals will offer their service, yet this service is ultimately not needed. Secondly, the marginal product of labour (the change in the level of output when one extra worker is hired) is zero. New labour that is provided results in no increase in total output for the economy, and so the labour is essentially wasted.
Secondly, it is assumed that wages in the modern sector are fixed and constant. According to Lewis, wages in the industrial sector are placed 30% above wages in the agricultural sector. The effect of this is workers joining the modern sector as they are incentivised by the prospect of higher wages and an improved quality of life. Typically, the supply curve slopes upward as wages must be raised to increase the quantity of workers willing to work. However, due to the fact that wages in the modern sector are already higher than wages in the subsistence sector, firms do not need to further raise their wages. Subsistence workers, whose labour amounts to nothing, happily move to the modern sector and the quantity of labour supplied in the modern sector increases without having to raise the wage rate. The result of this is a flat supply curve, which can be described as perfectly elastic.
Finally, Lewis states that for the developmental process to occur, the modern sector must reinvest all of its profits into capital. Expansion takes place as a result, and future economic growth is forecasted.
Now we have covered the assumptions of the model, we can begin to tackle to process of the structural transformation within the economy, and how the economic growth actually takes place.

The top diagrams illustrate the production function in the relative sectors where TPA is equal to the production in the agricultural sector, and TPM is the production in the modern sector. The variable K represents the differing levels of capital depending on the stage of the process the economy finds itself in.
The structural transformation begins as the surplus labour in the subsistence sector begins to evaporate. At point LA the maximum output, A, is produced. The initial surplus of labour is hence illustrated by the flat part of the curve past the point LA.
The bottom two diagrams showcase the marginal product of labour (MPL) which is equal to the demand for labour. There is a harmonious link between the top and bottom diagrams as when graphed, the MPL is equal to the gradient or first derivative of the production function. This explains why the marginal product of agricultural labour, MPA, is equal to zero from point LA and onward. However, one might question the sustainability and possiblity of workers living on a marginal product of labour of zero as in perfect competition, the MPL is equal to the wage. Thus, this would suggest that workers’ wages are zero. Lewis models that in an agricultural economy, wages are dictated not by the marginal product of labour, but rather the average product of labour, APA, as he assumes that all workers contribute equally to the total product. This suggests a non-competitve economy. Workers, incentivised by the higher wage in the modern economy, relocate to work in the industrial sector. This is diagrammatically shown by WM, the blue line which represents modern wages, surmounting the green line WA, which constitutes agricultural wages. As previously mentioned, the wage is fixed and the supply of labour is perfectly elastic as seen in the alternative diagram below.
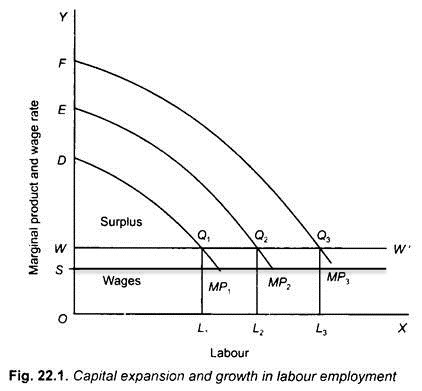
The way an economy of this kind grows is through the area WDQ1, labelled ‘Surplus’. The total wages paid by firms here is represented by the area WOLQ1, or wage multiplied by quantity of workers. However, total output is equal to the accumulation of all marginal product, or the area DOLQ1. Hence the ‘Surplus’ represents profits made by firms, which we have already stated must all be reinvested into capital. When the capital stock, K, increases, the marginal product of labour increases and so does the demand for labour. This is illustrated by the mapping in the first graph from curve TPM(K1) to curve TPM(K2). The outward shift results in an increase in total product, and hence GDP, from TPM1 to TPM2. The reason behind this shift is the increase in the size of the capital stock from K1 to K2.
As the marginal product of labour and hence the demand for labour has increased, more workers from the subsistence sector join the modern sector. This is illustrated by the increase in the quantity of labour from L1 to L2. This cycle repeats itself as L2 eventually increases to L3 owing to further reinvestment of profits and increase in the capital stock from K2 to K3.
Assuming the dualistic economy (where there are only two sectors) we can devise the following equation:
TPtotal= TPM+ TPA
This shows that total product in the whole economy, the GDP, is equal to the sum of the total product in the modern sector and total product in the agricultural sector. We know that TPM has increased owing to a larger workforce and a greater capital stock. Equally, according to the model, TPA has remained constant as although the subsistence sector has lost workers to the modern sector, the labour of the workers who have since moved amounted to nothing owing to the surplus labour with a marginal product of labour of zero. Hence, total product in the agricultural sector has not decreased and it is the same as it was before the workers left. TPA remains constant, TPM, increases, and so TPtotal must increase. At the same time, the population size has remained constant. Therefore, GDP per capita and incomes per capita have increased, further illustrating this economic boom.
An economy will likely enter a stage of rapid economic growth whilst enjoying the benefits of this cycle. A real world example of the Lewis model in action can be seen in the country of South Korea. The Korean economy experienced rapid growth through the 1970s as it underwent structural change which involved largescale industrialisation. The percentage of the population employed in the agricultural sector decreased from 65.9% (1970) to 35.8% (1989). Equally the percentage of workers employed in the modern sector increased from 7.1% to 27.5% over the same period. This was matched with a staggering increase in nominal GDP per capita from $280 to $5820.
However, as someone other than Lewis once said, ‘all good things must come to an end’. The second part of this theory is known as the ‘Lewis Turning Point’ (LTP). When an economy reaches the LTP, its economic growth begins to slow down. This is because the surplus labour, which the economy was previously utilising effectively, has completely evaporated. Excess labour from the subsistence sector has fully been absorbed into the modern sector. Now, the marginal product of labour in the subsistence sector is not zero. Any loss of workers from this sector will result in a decrease in total output in the agricultural sector, TPA. Equally, as there is no surplus labour remaining, wages in the modern sector must be raised to entice workers to internally migrate to urban areas. The effect of this is the supply curve beginning to slope upward, as seen below.
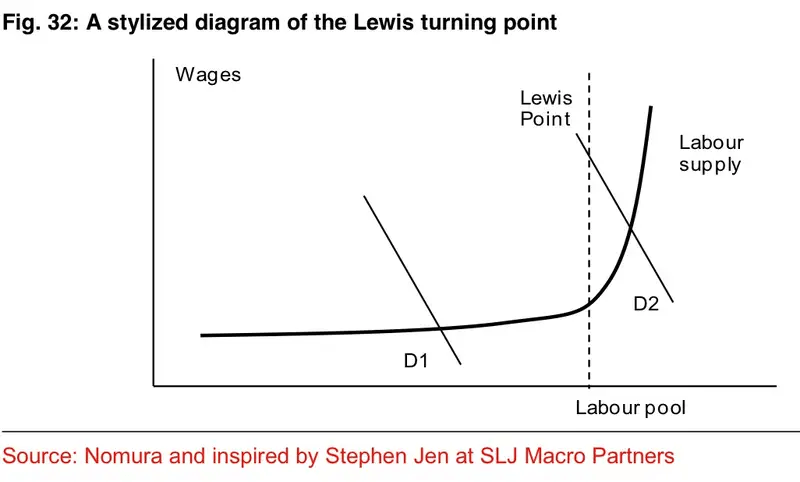
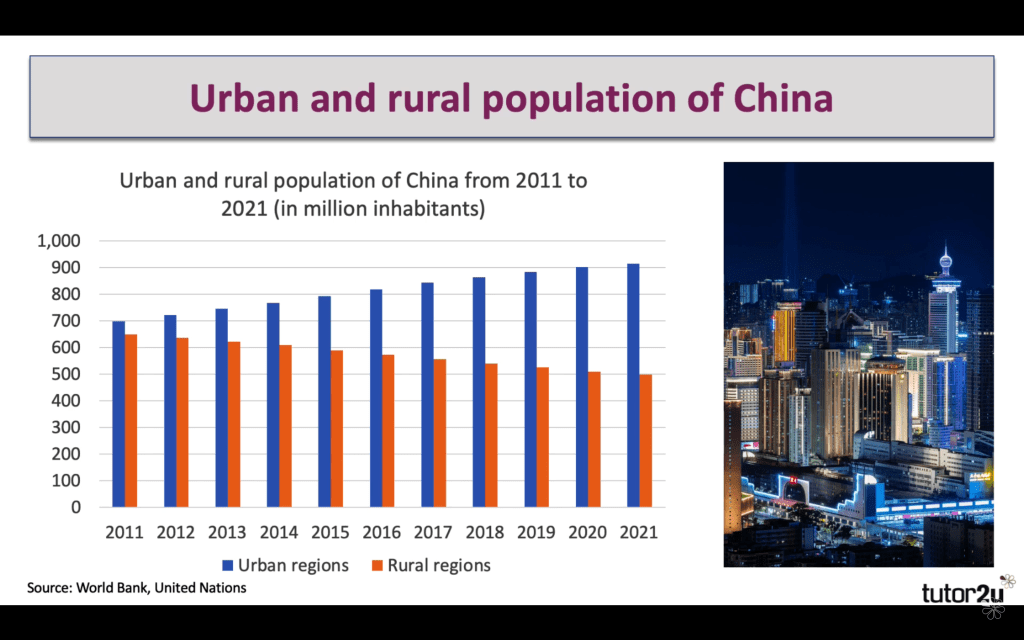
Past the Lewis Turning Point, supply is upward sloping. If there is further reinvestment of capital then demand for labour increases, resulting in an increase in wages and higher production costs for firms. This can lead to stagnation in an economy which will no longer enjoy the benefits of the fast-paced economic growth it had previously experienced. However, by this point, the country has likely established itself as a developed country. The most commonly used real world example of this is China. China has experienced monumental economic growth in recent years and now has the second largest economy in the world of $17.9 trillion. However, the rural population in China is now only 36.4%, with the other two thirds residing in urban areas. The graph below shows this structural transformation.
Further evidence of China reaching the Lewis Point is the fact that average urban wages have increased from 29,200 CNY to 97,400 CNY between the years of 2008 and 2020. Many provinces in China have also been increasing the minimum wage over the last decade. Although this can be damaging for an economy, one could argue that improved income equality is a victory for the wellbeing of Chinese residents. Additionally, China had a labour surplus of 75 million at the turn of the millennium. It is now projected that China will experience a labour shortage of 30 million by 2025.
But the model is not perfect. It is unlikely that there will be a large labour surplus in underdeveloped agricultural economies. Although China had a surplus of tens of millions by 2000, it had already established itself as a developed economy by this point. Equally, the prospect of wages remaining fixed in the industrial sector is low. Often, firms will give into labour union power when workers protest against wages they deem to be unsatisfactory. The result of this is firms raising wages to retain their workers, production costs increasing, and lower profits for the firm. Finally, the model assumes that there is spare capacity in urban areas for new workers to inhabit. Towns and cities may be fixed in size and unable to accommodate a large influx of migrants. The result of this is overpopulation and the rise of shanty towns and slums as seen in urban areas such as the city of Cape Town.
In summary, Sir William Lewis was well ahead of his time in the 1950s when he proposed a model that is still relevant to the growth of economies in the present day. Drawing inspiration from the developing economies of the Caribbean islands around him, Lewis created an accurate blueprint that forecasts development. While the model has proven applicable to countries such as South Korea and China, it relies on many ideals and assumptions. Often, other socioeconomic factors can have an effect on the true progression of a country. Nonetheless, the Dual Sector Model and the Lewis Turning Point continue to serve as common economic paradigms today.

One thought on “The Lewis Model of Development”