

Throughout centuries man has been searching for repetitive (or seemingly repetitive) patterns in evolution and social change, both of which underpin the economic world. One such pattern is based on the Golden Ratio (Phi).
This ratio is a consequence of a particular sequence identified by Fibonacci in the 13th century, and its fascination is based on the fact that it appears throughout science and nature so often that it has become an alluring basis for establishing patterns in what would otherwise appear to be random observations.
There is sparse available research into the extent to which Phi can be employed successfully in economic modelling. It’s relevance in a model which requires a vast amount of data accumulated over long periods necessarily requires it to be a constant which survives the ever changing parameters of a dynamic world. How reliable can it thus ever be? Are we obsessed with seeking it out even in the most obscure scenarios? Has it become a self-perpetuating holy grail allowing us to unlock otherwise hidden secrets?
Consider the financial markets. Every commodity in the world (including currency) is priced on a minute-by-minute basis by traders who take a number of factors into consideration. Supply and demand are major drivers, but a detailed analysis of price movements over different time-frames is also used in an attempt to forecast general market trends. A popular approach is to employ Fibonacci retracement levels[1].
Fibonacci retracement levels are a set of horizontal lines that indicate where the price could potentially retrace to, after an initial movement up or down. These levels are drawn based on key Fibonacci ratios, which are 23.6%, 38.2%, 50%, 61.8%, and 100%. Traders use these levels to identify and anticipate potential areas of support or resistance where they can enter or exit trades. For example, if the price trend for an asset is an uptrend and experiences a pullback, traders may look to buy at one of the Fibonacci retracement levels in anticipation of a continuation of the uptrend. Conversely, if a price trend is in a downtrend and experiences a rally, traders may look to sell at one of the retracement levels as a potential area of resistance.
Figure 1: Price movements in relation to Fibonacci levels for a typical financial instrument
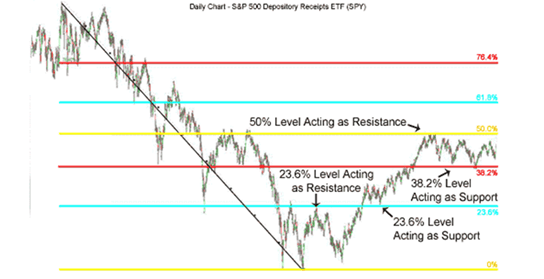
However, to what extent has this become a self-fulfilling prophecy? Note that using them in such cases always carries a health check and a recommendation for them to be used in conjunction with other indicators. Are the occasions where these levels are respected simply a result of faith in Phi forcing an artificial adherence to behaviour rather than some form of divine order? The jury is out.
Consider the attempts to model the life cycle of economic agents over recent decades. Efforts have been made to improve rigour in calculating critical measures that are employed[2].
On the other hand, the Golden Growth model (an economic theory that emphasises sustainable economic growth) is an established model in Macroeconomics which carries strong credibility[3].
A further, perhaps more striking example is the result of a study by Bert de Groot, a professor at the Erasmus School of Economics, where the presence of the ratio has been discovered rather than being initially assumed[4].
The hypotheses employed clearly include the use of Phi. Some arguably more effectively than others. Is that because we are simply hoping that this is an ingredient which improves our analysis or a consideration which has been ignored for decades – and if so – why?
Consider the performance of a business. Success or failure in commerce depends on a number of factors which can vary over time. These include quality of management, sociological trends, technological innovation and political pressure. So, in the midst of all this, how has Phi played it’s part through the recent history of commerce– if at all?
Some instances of its use suggest a more persuasive argument.
Take for example the sizing of retail products. There appears to be a strong correlation between the dimensional ratios of packaging and in particular the attractiveness to the consumer of offers such as ‘buy two and get the third one free’. In particular, if a vendor is to increase pack sizes by a constant ratio, within a range of quantities known to be desired by cohorts of his customers, the vendor can expect to match his market most accurately if he sets the size ratio to the square of the Golden Ratio and his price ratios at the Golden Ratio.[5]
Perhaps more striking evidence can be found in recent trends shaping the evolution of company logos which over the years have increasingly used Phi as a crucial feature in design. Examples include Apple, Google, Adidas, YouTube, FedEx, Toyota, National Geographic and many more.
It is almost impossible to confirm that a move towards a logo employing the ratio has directly resulted in an increase in sales/subscriptions due to Phi alone – but on occasion the timing of growth uncannily suggests this. Witness the evolution of the Starbucks logo.
Figure 2: The evolution of the Starbucks Logo

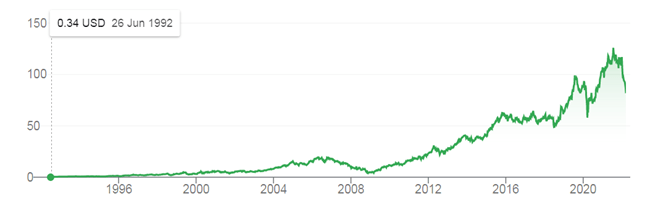
It underwent a radical change in 2011 which incorporated the ratio into its proportions and more simplistic design. A view of the company share price after that moment shows the start of a dramatic increase in share value (exceeding a previous high) following an extended period in the doldrums. Coincidence?
Figure 3: Starbucks Share Price
There is evidence to suggest that Phi is a ratio that cannot be ignored, but needs to be considered with the utmost caution. As highlighted already, here are numerous myths regarding how reliable its use can be, and also the many challenges it poses to established beliefs that it carries a divine message.
In conclusion, we still cannot be definitively sure of its power in analysing and interpreting economic behaviour correctly (either in broad terms or fairly accurately). A considerable amount of research is still needed to identify where and how it can be effective and when not. One thing we can assuredly assume is that this journey towards the end of the rainbow is ongoing and likely to grow in intensity in a changing world where economics is influenced by new and ever evolving factors.
[1]https://www.investopedia.com/articles/technical/04/033104.asp
[2]http://www.mnje.com/sites/mnje.com/files/071_-079-__-_endovitsky_et_al..pdf
[4]https://www.eur.nl/en/news/golden-ratio-and-its-meaning-economy
[5]https://openaccess.city.ac.uk/id/eprint/16301/1/BOGOF.pdf
