

Deadweight Loss
What is Deadweight Loss?
Deadweight Loss (DWL) is defined as the economic inefficiency that may occur in a market due to a new policy/event in said market. This change creates a distortion in the natural supply and demand equilibrium (equilibrium is defined as the supply and demand for a product being perfectly equal) set by the free market; the DWL refers to the gross value of the transactions which would have occurred if said market was in equilibrium, but did not due to the newfound inefficiencies in the market.
 |  | ||
An example of this in practice can be described using the graphs below:
If you were to assume that a market operates in perfect competition and the cost of a product, a set of hinges for example, is set at £0.50 and each seller sells hinges for exactly £0.50, then every consumer for whom a set of hinges has a marginal benefit which is greater than £0.50 would go on to buy them. Because of this, it is apparent that £0.50 is the price of equilibrium in this market. The graph for this type of equilibrium can be seen above (left). However, changing market conditions can skew this balance; for example, if hinges were to become monopolized by a single producer and said producer were to raise the price of hinges to £1.00, while the generated revenues may be greater, the overall marginal benefit to the economy per sale of hinges would decrease. By raising the price of hinges to £1.00, all customers who receive a marginal benefit between £1.00 and £0.50 are now excluded from the customer base. This is an example of deadweight loss as the customers who were previously able to purchase the hinges (transactions which create cashflows and transactions) are now unable/unwilling to purchase the product (i.e. transactions that would have occurred are now not occurring = DWL, represented by the area shaded orange on the graph above (right)). This idea is often referred to as a consumer being ‘priced out of the market’.
The example above describes an example of deadweight loss due to a monopoly, however; there are various other events which can cause this type of economic inefficiency.
DWL can also appear when consumers buy more of a product than they should in a perfect equilibrium. In other words, when the marginal cost of a product to the consumer is higher than its marginal benefit as they are purchasing too much of it. Using a similar example, if a nation’s government was to provide a subsidy (money provided by a government in order to allow producers to keep the price of a commodity/product low) of £0.10 on the hinges, the competitive market price would then be reduced to £0.40. This would mean that consumers with a marginal benefit between £0.40 and £0.50 would now also purchase the product at this lower price. This increased demand would eventually lead to suppliers increasing production, once again shifting the economy away from the equilibrium mentioned previously and creating DWL due to the overproduction of the product (done to maximize returns for the producers rather than for the economy). In this example, the DWL is the total net loss to society from producing too many units of a product; organizations produce more units than is optimal to meet/exceed demand and maximize returns at the cost of social efficiency.
Taxes can also create DWL. However, they have the opposite effect of a subsidy. Rather than artificially reducing price to increase demand, taxes artificially increase price in order to discourage consumers from purchasing a product and therefore lower demand. A common example of this would be the high tax rates applied to products such as cigarettes or alcoholic beverages in order to dissuade customers from consuming them. The increase in price due to tax creates a DWL as it reduces demand and reduces the amount that sellers receive as the number of units sold decreases. (Units sold also decreases when supply reduces because producers are less willing to manufacture/supply goods, but this only occurs secondary to the reduction in demand.) These lost transactions are a clear example of DWL occurring in a market.
What impact does DWL have?
While some DWL is inevitable in a market as supply and demand fluctuate naturally, high levels of DWL can have serious effects on an economy’s growth.
The first and most apparent effect of DWL is the lower economic welfare which can be observed in a market as less transactions occur, as a surplus of both consumers and producers is created, therefore generating less overall wealth. On a larger scale, this can lead to lower national income levels, GDP and even standards of living.
Furthermore, the reduction in efficiency which comes with high levels of DWL can affect economic growth as people are less inclined to work, invest or produce as the marginal benefit they receive is lower. On a global scale, having abnormally high levels of DWL is detrimental for a country’s economy as said country might struggle to compete internationally as productivity stagnates, placing them at a disadvantage in the global market relative to competitors. This reduction in competitiveness and productivity can also indirectly cause increased government spending and place a further burden on tax payers as government services such as subsidies and benefits may increase to combat the high levels of DWL.
Overall, when high levels of DWL can be seen not only in one sector but across multiple sectors the inefficiencies seen in the market can compound and lead to the stagnation of economic growth and an economy’s productivity.
It is easier to understand the idea of how DWL causes lower growth if the concept is presented within an example. Take a country where the main exports/forms of employment are oil production and agriculture. If a large subsidy were to be imposed by the government on oil sales with the intention of boosting sales and allowing oil extraction companies to continue growing in order to allow them to keep up with international competitors. If the imposed subsidy is excessive it can lead to overconsumption (therefore placing a large burden on government budgets), creating DWL in the market, and in extreme cases lead to criminal activities such as smuggling, further increasing the marginal cost of the product in the economy, eventually leading to an accumulation of DWL.
Similarly, with the example of agriculture, if a government were to impose very high Land Value Taxes on farmers, this would indirectly raise food prices as a farm’s operating expenses would rise. In turn, this would lead to a reduction in purchases as consumers are ‘priced out’, both reducing farm income and removing marginal benefit from both producers and consumers, leading to DWL.
The examples above are very specific and there are an almost infinite amount of ways in which DWL can be created, but all of them share the common theme that DWL is created when the marginal benefit of a purchase/transaction to an economy is less than the marginal cost the transaction has for the economy.
Harberger’s Triangle
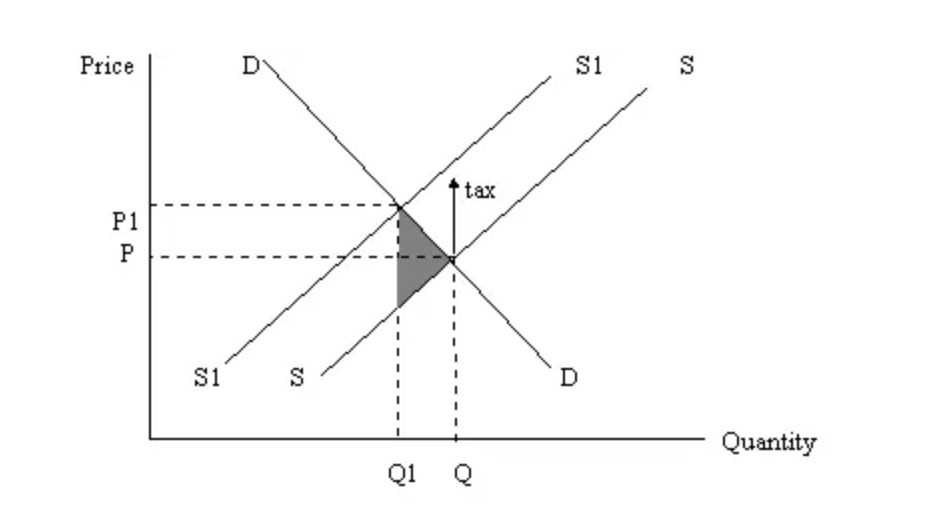
Credited to Arnold Harberger, Harberger’s Triangle is used to demonstrate on a supply and demand graph the DWL linked to government actions and policies (these might include subsidies, taxes and tariffs to name a few). The dark grey area on the graph below represents this triangle and is defined as the area between the tax box, the demand curve and the supply curve which accounts for any new policies/inefficiencies present in the market (N.B. this definition is for when tax causes the inefficiency, it can also be caused by a fluctuation in demand or price wedges.). The shaded area is representative of the fact that the supply and demand curves are cut short, and therefore the quantity traded is reduced so the curves no longer intersect at an equilibrium, indicating that DWL has been created.
How can Deadweight Loss be reduced?
Strangely, the factors that cause DWL in a market can also reduce it if used and implemented correctly in a more structured manner. For example, if an economy is experiencing DWL due to taxes, adjusting tax rates to broader, less product specific rates can reduce the DWL in the market as it would lower the overall marginal cost that consumers experience. (Avoiding high levels of income tax can also work to this effect as high levels of income tax can discourage work and push people towards the social benefit system, which would create a further burden on the government.)
This idea works similarly for subsidies. Sometimes subsidies, if targeted at the wrong products and sectors, can cause overproduction of a certain product or good; this eventually leads to DWL developing in the market. However, when these subsidies are eliminated and more positive subsidies are introduced in areas where they can correct a market failure or a distortion in the price of a product, they can reduce DWL in an economy and actually boost economic growth as consumers are priced back into goods which were previously over taxed or monopolized, driving prices up. In essence, the subsidy has to create more marginal benefit to the economy than marginal cost to the economy (i.e. not encourage over-consumption or over-production), which allows it to reduce the DWL.
Finally, things like promoting competitions (i.e. regulating and reducing the monopolization of markets), price controls and reduction of overall costs can all be effective in controlling and reducing DWL in an economy as they all work to ensure the overall marginal benefit a transaction has on an economy is greater than the overall marginal cost it has.
Conclusion
DWL is an inefficiency in a market which is created by distortions and fluctuations in supply and demand. While it can be very detrimental for an economy’s stability and growth, it can be managed and reduced through the effective and efficient implementation of government policy.
