

What is The Solow Growth Model?
Also known as the Solow-Swan model, the Solow growth model is a foundational economic framework often used to explain and recognise trends in long-run economic growth. It does this by looking at factors like capital accumulation, labour growth and productivity increases (often driven by technological progress).
Structure, Mathematics and Assumptions
N.B. this model assumes constant returns to scale, exogenous technological progress (advancements that originate outside of an economic system), the absence of government and no international trade.
Mathematically, the Solow Model comes down to a singular non-linear differential equation that represents the capital per effective worker in an economy. The textbook example of the Solow-Swan model is set in a continuous time-frame and follows the assumptions stated above.
The contribution of a single ‘good’, or, in other words, output, is found using two factors of production: labour (L) and capital (K). These factors are combined in an aggregate production function (a function which returns the sum (or total output) of all production functions of individual producers within an economy/nation) in order to produce a single output for the model. The production function is given by the equation below:
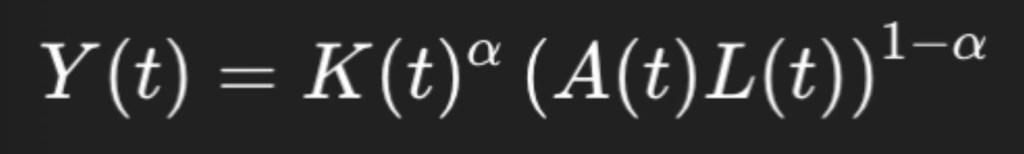
Where:
- t = time
- α = output elasticity with regards to capital (0 < α < 1)
- A refers to labour-augmenting technology, making A(t)L(t) representative of the effective labour in an economy as technological advancements are made
- K and L as stated above
Each variable A and L has an initial value of A(0) and L(0) respectively at time 0, therefore allowing their growth to be projected as L(0)ent and A(0)egt (in this case, n and g are the growth rates of labour and technological progress).
The model also allows the relationship between capital stock, decay of capital stock and savings to be established and represented mathematically, which can be used to indicate whether individuals in an economy are becoming more wealthy over time. This relationship is represented in the differential equation below:
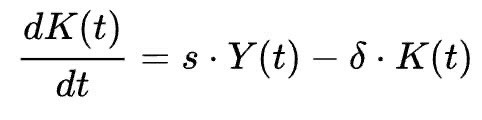
In this equation, the left hand side is the derivative of the capital stock(total value of physical, man-made assets in an economy at a given time) with respect to time; this value is positive when the total savings/investable income (sY(t) where s is the savings rate of income) in an economy is greater than the absolute decay of the capital stock available (δ *K(t)). When the derivative of the capital stock in an economy is positive, this suggests that the total amount of capital stock is growing with respect to time, indicating, aside from the growth of capital, overall economic development and growth.
The model also allows for wealth creation to be measured and quantified with the equation:
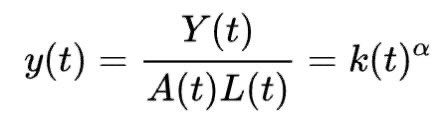
This is possible because the production function Y has constant returns to scale(i.e. when the inputs double the outputs also double), and can therefore be written as output for effective unit of labour (y), indicating the wealth created per input of labour by an economy.
Capital Intensity Calculations/Assumptions
On a slight tangent to the above, a different aspect of an economy the model reveals are the dynamics of Capital Intensity (referring to the amount of capital used per unit of labour throughout the production process for a given good) in a market. The variance in the Capital Intensity is given by one of the key equations of the Solow-Swan model, seen below:
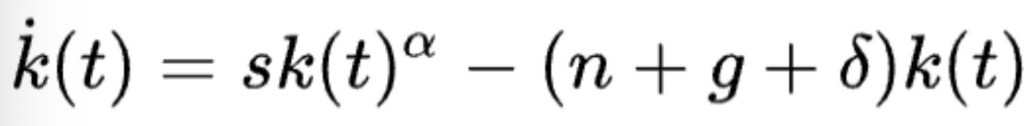
The first term, sk(t)α is equivalent to the investment back into the economy that results due to one unit of effective labour (sk(t)α = sy(t), where y(t) is the function of the output of a unit of effective labour with respect to time). The second term (n+g+ δ)k(t) is the amount of investment required to prevent k(t) from falling/reducing. Through this equation Solow and Swan suggest that eventually the value of k(t) will converge to a steady value of k* (where the first term is equal to the second term).
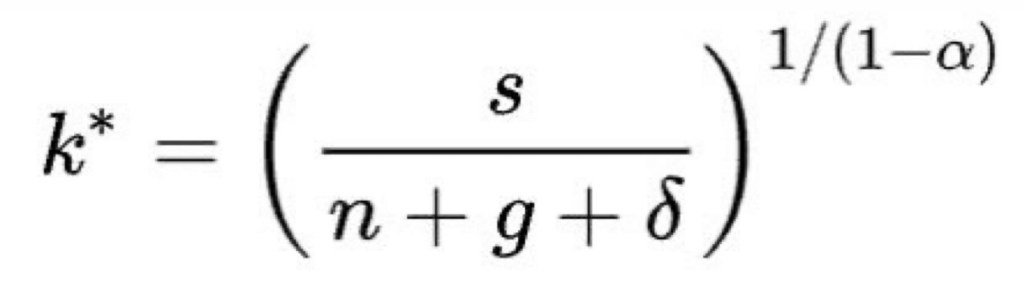
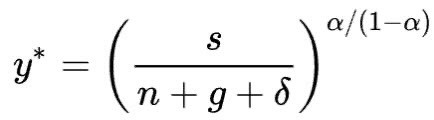
At this point, the stock of capital and effective labour in an economy are growing at a rate of (n+g) and it is therefore possible to calculate the steady-state creation of wealth (y*) that corresponds with the steady-state value of capital intensity (k*):
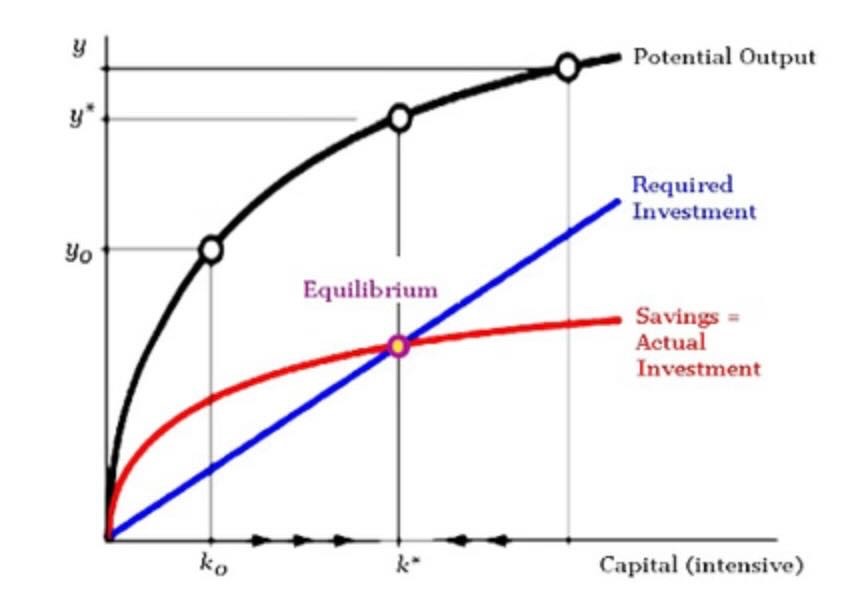
The idea of maximising capital intensity at an equilibrium is often represented in a graph such as the one below:
Golden Rule Saving Rate in the Solow-Swan Model
Through the model’s assumption of constant returns in an economy, the output Y (the total production in an economy) grows at a constant rate. This means that the model suggests that an economy will eventually converge to a balanced-growth equilibrium, irrelevant of the production’s starting point. (N.B. in this situation the increase in output per worker is only impacted by the rate of technological advancement, rather than the capital per worker and/or the savings rate.)
At the equilibrium reached for the value k* mentioned above, since, by definition and as can be obtained from the first equation stated above, K(t)/Y(t) (capital with respect to time divided by labour with respect to time) is equal to k(t)1-α (the steady-state level capital per worker), the equation below can be derived:
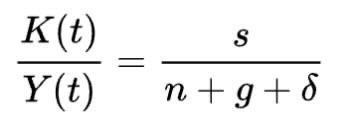
This equation suggests that, at equilibrium, the capital-output ratio is dependent only on the saving(s), growth(n+g) and depreciation (δ) rates; this idea gives the Solow-Swan interpretation of the golden rule saving rate(the rate of savings that allows a maximum steady-state growth of consumption)
Usage and Effectiveness
The Solow Swan model is most commonly used in long-term economic growth analysis; the model thrives in this area as it highlights and isolates three of the major components in growth (capital accumulation, labour population growth and technological progress) and treats each of these factors separately. Additionally, rather differently to many other models, it emphasises and recognises the importance of technological advancement in sustained growth (mainly due to the increase in efficiency which is often observed alongside these advancements).
The model also touches on the effect of convergence dynamics: the idea that countries and economies with similar structural parameters will converge in income levels over time and eventually reach the same income per capita. This makes it incredibly well suited to the analysis of under-developed economies regardless of whether they have similar structural parameters to already developed economies, suggesting said under-developed economies may grow quicker than the established economies due to the ideas convergence dynamics introduce.
Overall, the Solow-Swan model gives detailed insights into the saving behaviour of an economy, allowing a relationship between the behaviour of an economy’s population and the growth it experiences over a period to be established, which then helps project growth for other economies around the world.
